
key takeaways
- Combine Leading and Lagging Indicators: Never rely on a single technical tool; use lagging indicators to confirm trends and leading indicators to time entries.
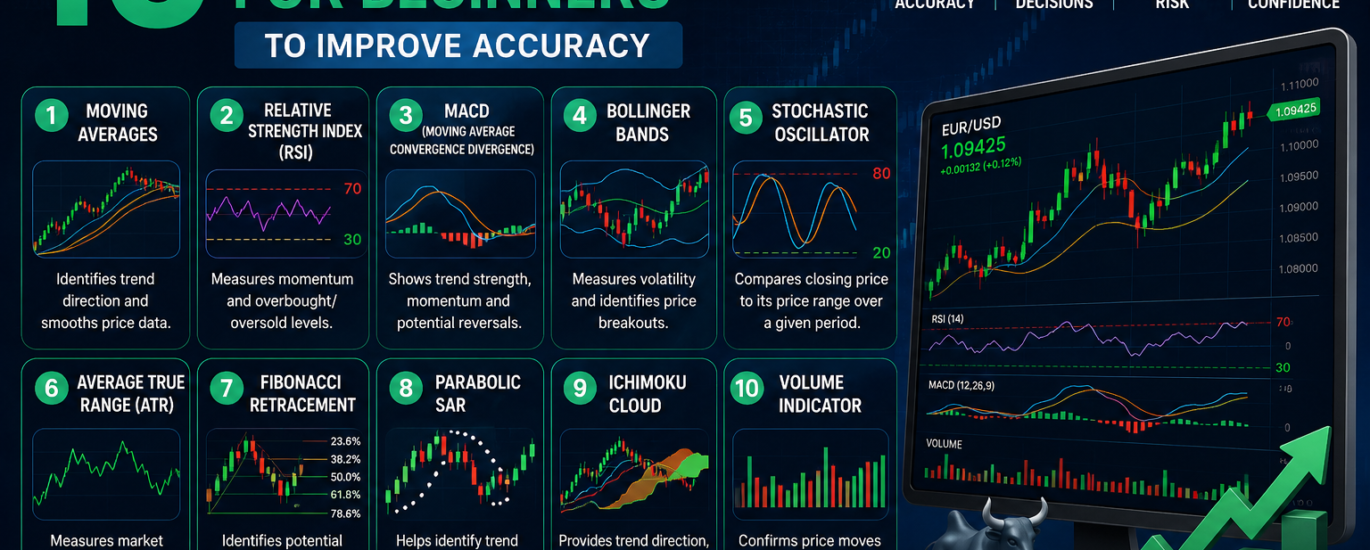
- Master the Core Three: Moving Averages, RSI, and MACD form the foundation of most successful beginner forex trading strategies.
- Manage Risk with ATR: The Average True Range (ATR) indicator tells you exactly where to place stop-loss orders based on real market volatility.
- Avoid Chart Clutter: Keep your trading layout clean by using a maximum of two or three technical indicators for forex at any given time.
- Understand Market Context: Trends require different tools than sideways, ranging markets; identify the market phase before picking your indicator.
- Practice on Demo Accounts: Test every new forex indicator strategy in a risk-free environment for at least 100 trades before risking real capital.
10 Best Forex Indicators for Beginners to Improve Trading Accuracy
Entering the foreign exchange market can feel like walking into a massive wall of noise. Every single second, currency prices move, charts tick up and down, and thousands of global events influence the market. According to recent industry statistics, over 70% to 80% of retail traders lose money in their first year. The primary reason for this high failure rate is not a lack of effort; it is a lack of direction. Beginners often trade based on raw emotion, guesswork, or messy charts that look more like abstract art than financial tools.
To survive and thrive in this environment, you need an objective way to read price action. This is where the best forex indicators for beginners come into play. Technical tools remove the emotional guesswork from your daily routine, transforming chaotic price bars into structured, actionable data.
Instead of guessing where a currency pair might move next, these mathematical formulas help you identify clear entry and exit points. This comprehensive guide breaks down the top ten trading tools, explains how they work in plain language, and gives you actionable strategies to improve your overall trading accuracy in forex. You will learn how to turn confusing charts into a clear, reliable roadmap for long-term growth.
Understanding Forex Technical Analysis and Indicators
Before adding lines, bands, and histograms to your trading platform, you must understand what these tools actually do. Forex technical analysis is the study of past market data, primarily price and volume, to predict future price behavior. Forex indicators are simply mathematical calculations applied to a currency pair’s price history to help simplify this process.
The Difference Between Leading and Lagging Indicators
Technical tools generally fall into two distinct categories: leading and lagging indicators. Understanding the core difference prevents you from taking conflicting signals on the same chart.
- Lagging Indicators: These tools follow the price action. They use past price data to confirm that a specific trend has officially started or changed direction. Because they look backward, they give signals after the price move begins. While you might miss the absolute bottom or top of a move, lagging indicators offer high security by keeping you on the right side of a major trend.
- Leading Indicators: These tools attempt to predict where the price is heading next. They measure the momentum of a move and signal potential reversals before they actually happen. They help you enter trades early, but they also produce more false signals when the market moves erratically.
Why Beginners Need a Structured Technical Approach
Without a structured approach, human psychology takes over. You might buy a currency pair simply because it looks low, only to watch it drop further. Or you might panic and sell a winning trade too early out of fear.
Using technical indicators for forex forces you to follow clear rules. They act as an objective filter, telling you when to step into the market and when to sit on your hands. A structured approach ensures consistency, and consistency is the only way to build long-term profitability in currency trading.
Trend-Following Forex Indicators
Trend-following tools work best when the market moves in a clear, sustained direction. They help you identify the path of least resistance so you can follow the dominant market momentum.
Moving Average Indicator (SMA and EMA)
The moving average indicator is the ultimate foundation of trend analysis. It smooths out erratic price fluctuations by calculating an average price over a specific number of periods. The two most popular versions are the Simple Moving Average (SMA) and the Exponential Moving Average (EMA).
Simple Moving Average (SMA)  =  (Sum of Price over 'n' Periods) / n
Exponential Moving Average (EMA) =  [Current Price * Weight] + [Previous EMA * (1 - Weight)]
The SMA treats all data points equally, while the EMA places more weight on recent price changes. This makes the EMA react faster to sudden market movements.
Actionable Tip: Use a two-moving-average system to find high-probability setups. Place a 20-period EMA (fast) and a 50-period EMA (slow) on your daily chart. When the 20 EMA crosses above the 50 EMA, it signals a new uptrend, giving you a green light to look for buy entries. When it crosses below, the trend turns down.
| Indicator Type | Best Setting | Market Condition | Primary Benefit |
| Simple Moving Average (SMA) | 50, 200 Periods | Long-Term Trending | Identifies institutional support/resistance |
| Exponential Moving Average (EMA) | 9, 21, 50 Periods | Short-Term Trending | Reacts quickly to sudden momentum changes |
Moving Average Convergence Divergence (MACD Indicator)
The MACD indicator is a versatile momentum oscillator that tracks trends by showing the relationship between two moving averages. It consists of a MACD line, a Signal line, and a visual histogram that grows or shrinks based on trend strength.
When the MACD line crosses above the Signal line, bullish momentum increases. When it crosses below, bearish momentum takes control. The histogram displays the exact distance between the two lines, helping you see whether a trend is gaining strength or losing steam.
Ichimoku Cloud
The Ichimoku Cloud is a comprehensive tool that defines support and resistance, identifies trend direction, and measures momentum all at once. While it looks complicated at first glance, it is highly visual and easy to read once you understand the basic components.
The “Cloud” (Kumo) is the most critical element. When the price trades above the cloud, the overall market trend is strongly bullish. When the price remains below the cloud, the trend is distinctly bearish. The thickness of the cloud represents the strength of historical support or resistance in that specific price zone.
Momentum and Oscillator Indicators
Oscillators are designed to help you spot market extremes. They track the speed and velocity of price movements, telling you when a currency pair has moved too far in one direction and is ripe for a correction.
Relative Strength Index (RSI Indicator)
The RSI indicator measures the speed and change of price movements on a scale from 0 to 100. By default, it uses a 14-period setting. The chart features two key baseline levels: 70 and 30.
- Overbought (Above 70): Indicates that buying pressure has been intense, and the currency pair may be overvalued. Look for potential short-selling opportunities or exit long positions.
- Oversold (Below 30): Indicates that selling pressure has been extreme, and the pair may be undervalued. Look for potential buying opportunities.
                  100
RSI = 100 - ------------------
             1 + (Avg Gain / Avg Loss)
Real-World Example: Imagine trading the EUR/USD pair. The price hits a new high, but the RSI makes a lower high, staying below 70. This mismatch is called a bearish divergence. It shows that even though the price is rising, the actual buyers are losing power. A sharp downward reversal usually follows soon after.
Stochastic Oscillator
The Stochastic oscillator compares the specific closing price of a currency pair to its price range over a set period. It uses two lines, %K and %D, and moves between 0 and 100. Its overbought and oversold thresholds are slightly tighter, set at 80 and 20.
Because it reacts rapidly, it works well as one of the best indicators for day trading inside sideways markets. When both lines drop below 20, flatten out, and then cross upward, it signals a reliable short-term buying opportunity.
Commodity Channel Index (CCI)
The CCI measures the current price level relative to an average price over a specific window. It helps traders identify cyclical turns in currency pairs.
Unlike the RSI, the CCI does not have a fixed 0-to-100 ceiling or floor. Instead, it oscillates around a zero line, moving between +100 and -100. A reading above +100 means the price is well above its historical average, indicating a strong uptrend. A drop below -100 shows aggressive selling that could lead to a bounce.
Volatility Indicators for Risk Management
Volatility tools measure how fast and far a price moves. They do not tell you which direction the market will go, but they show you how violent the price action is, which is crucial for managing your risk.
Bollinger Bands Indicator
The Bollinger Bands indicator consists of three core lines: a middle simple moving average (usually 20 periods) and two outer bands calculated using standard deviation. The outer bands expand when market volatility increases and contract when volatility drops.
Upper Band = 20 SMA + (2 * Standard Deviation)
Middle Band = 20-Period SMA
Lower Band = 20 SMA - (2 * Standard Deviation)
The price spends roughly 90% of its time trading between these two outer bands. When the bands squeeze tightly together, it means volatility is exceptionally low. This consolidation often acts as a precursor to a massive, explosive price breakout in either direction.
Average True Range (ATR)
The Average True Range (ATR) is a pure volatility indicator. It looks at the high, low, and closing prices of previous candles to calculate the average trading range over a set period. It does not provide buy or sell signals; instead, it outputs a raw pip value.
If the ATR for the GBP/USD pair reads 120 pips on a daily chart, it means the pair moves an average of 120 pips per day. You can use this data to place your stop-loss orders safely outside the normal daily noise of the market.
Actionable Tip: When entering a trade, look at the current ATR value. Multiply that number by 1.5 or 2, and use the result as your stop-loss distance. If the ATR is 40 pips, setting a 60-to-80 pip stop loss prevents you from getting knocked out of a valid trade by temporary market noise.
Volume and Support/Resistance Tools
Volume and structural tools help you verify the underlying strength behind price movements. They show whether the broader market is putting real money behind a breakout or if the move lacks genuine institutional support.
Fibonacci Retracement Levels
Fibonacci Retracement is a tool that draws horizontal support and resistance lines based on mathematical ratios derived from the Fibonacci sequence. The most critical percentages are 38.2%, 50%, and 61.8%.
Key Fibonacci Ratios: 0.236, 0.382, 0.500, 0.618, 0.764
When a currency pair makes a strong move upward, it rarely moves in a straight line. It inevitably pulls back to rest. By drawing the Fibonacci tool from the absolute swing low to the swing high, you can pinpoint these hidden retracement levels where buyers are waiting to rejoin the trend.
Pivot Points
Pivot Points are objective, mathematical support and resistance levels calculated from the previous day’s high, low, and closing prices. Because they are based on fixed historical math, every trader sees the exact same levels on their charts.
Pivot Point (P) = (Previous High + Previous Low + Previous Close) / 3
Support 1 (S1)  = (2 * P) - Previous High
Resistance 1 (R1)= (2 * P) - Previous Low
Day traders use these lines to predict intraday turning points. If the price opens above the central pivot point, the bias for the session is bullish, making support levels ideal entry targets.
Chaikin Money Flow (CMF)
The CMF indicator measures the volume of institutional money flowing into or out of a currency pair over a set period. It calculates whether the market is accumulating (buying) or distributing (selling). A CMF value above zero indicates institutional buying strength, while a value below zero confirms strong selling pressure.
Building a Winning Forex Indicator Strategy
Possessing a toolbox full of high-quality tools is only half the battle. To achieve true consistency, you must combine individual elements into a cohesive, rule-based forex indicator strategy.
How to Combine Leading and Lagging Indicators
A common error made by beginners is overloading a chart with three different oscillators, like the RSI, Stochastics, and CCI. Because these tools all measure momentum, they will give you the same signal at the exact same time, creating an illusion of confirmation.
Instead, combine one trend-following tool (lagging) with one momentum tool (leading). Use the trend indicator to determine the direction of the trade, and use the momentum indicator to time your entry perfectly.
The Core Beginner Strategy Setup
Let’s build a clean, reliable setup using the tools we have discussed. Add a 50-period EMA and a 14-period RSI to your 4-hour chart.
- Identify Trend: Look at the 50 EMA. If the price is trading above the line and the line slopes upward, look exclusively for buy setups.
- Wait for Pullback: Wait for the price to drop back down close to the 50 EMA line without breaking below it.
- Check Momentum: Look down at the RSI. If the RSI has dropped below 30 (or close to it) during this mild pullback, it means the short-term sell-off is exhausted.
- Execute Trade: Enter a long position as soon as a bullish confirmation candle closes, placing your stop loss safely below the recent swing low.
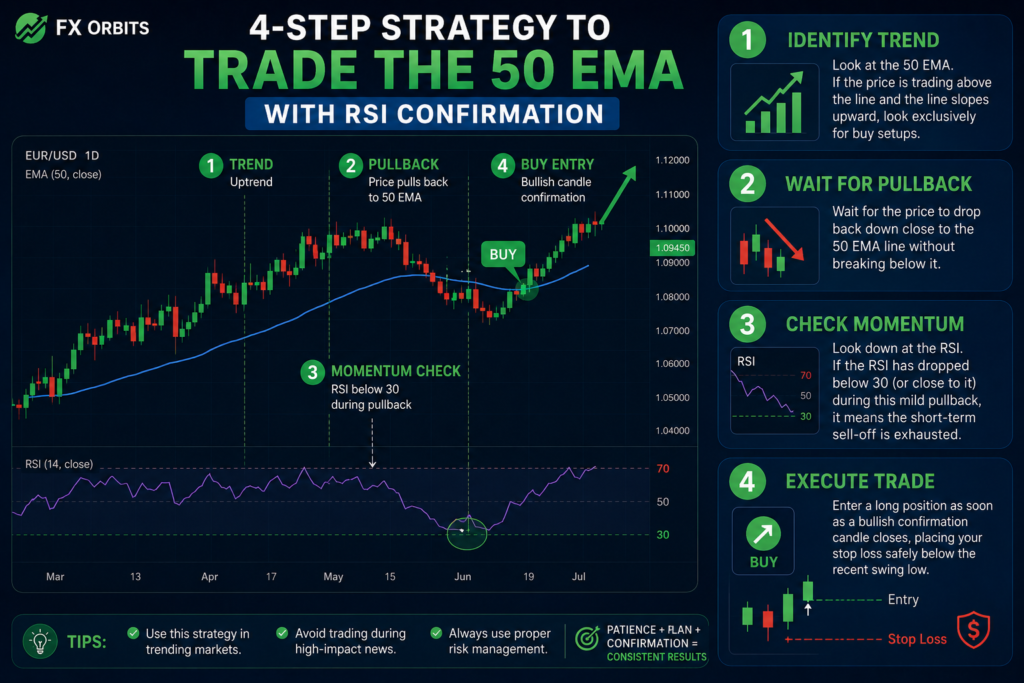
[Is Price Above 50 EMA?] ── Yes ──> [Is RSI Below 30/Oversold?] ── Yes ──> [Execute Buy Order]
How to Avoid Analysis Paralysis
Analysis paralysis happens when you have too many conflicting indicators on your screen. Your moving average might say “buy,” your RSI might say “sell,” and your Bollinger Bands might say “sit still.” To prevent this confusion, limit your chart setup to a maximum of three total indicators. If an indicator does not directly influence your entry or exit execution, remove it from your layout immediately.
Essential Forex Trading Tips for Beginners
To maintain a healthy trading account, master the basic operational rules of the market. Technical indicators are useful, but they only work when paired with disciplined risk management.
The Power of Risk-to-Reward Ratios
Never take a trade where your potential risk matches or exceeds your potential profit. Always aim for a minimum risk-to-reward ratio of 1:2. This means if you risk $50 on a trade by setting a tight stop loss, your take-profit target should be positioned to make at least $100 if the trade goes your way.
Risk-to-Reward Ratio = (Entry Price - Stop Loss) : (Take Profit - Entry Price)
With a clean 1:2 ratio, you can lose 60% of your total trades and still walk away with a profitable trading account at the end of the month.
Why You Must Use Free Forex Indicators First
Do not waste thousands of dollars buying expensive custom indicators or “magic trading bots” sold online. The free forex indicators built directly into standard platforms like MetaTrader 4, MetaTrader 5, or TradingView are the exact same tools used by professional fund managers worldwide. Master these standard tools before looking for premium alternatives.
Tracking Performance in a Trading Journal
Keep a detailed log of every single trade you execute. Write down the currency pair, the exact indicators you used, the reason you entered, and the final financial outcome. Reviewing this journal every weekend shows you which setups make money and which ones cause losses, allowing you to optimize your strategy over time.
Growing Your Business Beyond the Markets
Succeeding in trading requires a clear digital strategy, absolute discipline, and a deep understanding of automated web technologies. If you manage a financial blog, a trading advisory service, or an independent business, simply having a great strategy is not enough to survive. You need to attract consistent online traffic, construct high-performance digital platforms, and rank at the absolute top of search engine results pages to stay ahead of the competition.
At fxorbits, we focus on helping businesses scale through professional WordPress web design and robust search engine optimization. Our expert team has successfully helped over 80 businesses grow online, converting complex search data into clear growth roadmaps. We build responsive, highly secure platforms tailored to your specific business niche, allowing you to focus completely on your operations while we manage your digital visibility.
Frequently Asked Questions (FAQs)
What is the most accurate forex indicator for beginners?
No single tool offers absolute accuracy, as indicators simply process historical price data. However, the Moving Average is widely considered the best starting point for beginners. It clearly identifies the overall trend direction, helping new traders avoid the costly mistake of trading against dominant market momentum.
Can I trade forex using only one indicator?
While you can trade with a single tool, like a Moving Average, it is rarely recommended. Using only one tool often leads to false signals during volatile market shifts. Combining a trend-following tool with a momentum oscillator provides a more balanced and accurate view of the market.
What are the best indicators for day trading currency pairs?
The Relative Strength Index (RSI), Stochastic Oscillator, and Bollinger Bands are exceptional choices for daily trading styles. These specific tools react rapidly to short-term price movements, helping intraday traders spot sudden overbought or oversold conditions and minor trend reversals during rapid market sessions.
Are leading or lagging indicators better for beginners?
Lagging indicators, such as Moving Averages, are generally safer for beginners because they focus on trend confirmation. They prevent you from entering trades prematurely. While leading indicators offer earlier entry setups, they produce more false signals, requiring advanced market experience to filter out effectively.
How many indicators should I put on my trading charts?
You should keep your layout clean by using a maximum of two or three tools at once. Overloading your platform with five or more lines creates conflicting data signals, which leads to analysis paralysis. Focus on high-quality interpretation rather than adding massive visual clutter to your workspace.
What is the difference between SMA and EMA?
The Simple Moving Average (SMA) calculates the average price equally across an entire set period. The Exponential Moving Average (EMA) places a higher mathematical weight on recent price bars. This structural difference makes the EMA react significantly faster to sudden price fluctuations in the market.
Are the standard indicators on TradingView and MetaTrader free?
Yes, core technical indicators like the RSI, Moving Averages, MACD, and Bollinger Bands are free. They come pre-installed on professional platforms like MetaTrader and TradingView. Beginners should completely master these standard analytical tools before spending money on expensive custom algorithms.
Conclusion
Navigating the foreign exchange market requires a reliable analytical framework. Using the best forex indicators for beginners allows you to eliminate emotional bias, interpret market structure objectively, and systematically improve your overall trading accuracy in forex. By mastering core tools like Moving Averages, the RSI, and the Average True Range, you build a robust foundation for long-term survival in the markets.
Remember to keep your trading charts clean, manage your risk per trade with discipline, and thoroughly test every single strategy on a demo account before risking real money. Success in this field does not come from finding a magical shortcut; it comes from applying reliable rules consistently day after day.
If you are ready to scale your digital presence, build a high-performance web platform, or maximize your search engine rankings, work with an experienced team that understands online growth. Contact fxorbits today for a free SEO consultation.
